
What is quality?
The concept of quality in healthcare has now been enshrined in legislation through the Health and Social Care Act (2012).12 This built on the work led by Lord Darzi in the 2008 report, High quality care for all: NHS next stage review, where quality is defined and viewed at the heart of three overlapping dimensions, patient experience, clinical effectiveness and patient safety.31, 44
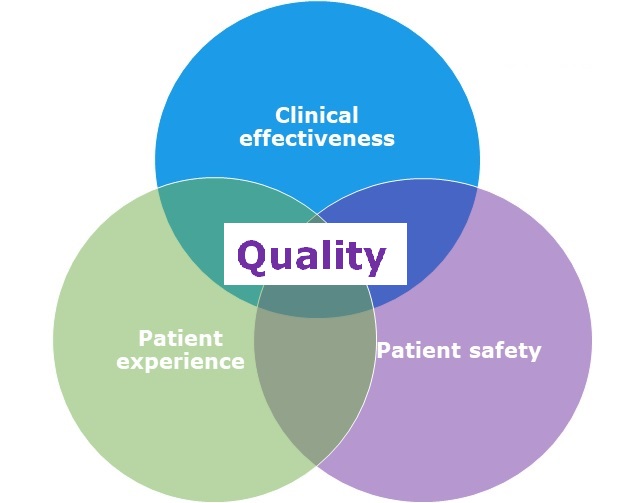
A high quality service is achieved when all three dimensions of quality are in place:
Patient experience: is about respecting the individual rights of the patient, treating them with dignity and compassion. The aim should always be to give the patient the most positive experience possible.
Clinical effectiveness: is achieved by using the best available evidence to improve the health outcomes of patients.
Patient safety: is ensured by protecting patients safety, by identifying and eliminating avoidable harm and risks in the delivery of their care.44
For effective quality improvement it should involve the following:
- Patient and stakeholders input
- Organisational networking and collaboration
- Comprehensive review of relevant literature
- Application of what has been learnt into practice.31
![]()
Patient and Public Involvement
In 2017 the Healthcare Quality Improvement Partnership (HQIP) produced guidance regarding patient and public involvement in quality improvement and introduced their guidance as follows: “Patients and the public offer a unique voice to service development, identifying required improvements and inefficiencies first-hand as ‘experts by experience’. PPI aims for the ongoing, transparent, and strategic-level partnership between healthcare organisations, patients, and the public, throughout quality improvement project life cycles, and, ultimately, patient-led activity.” 35 A range of patient / public involvement methods can be used including surveys, comment cards, patient stories and focus groups – see page 6 for further information on how to use these methods with the different quality improvement tools. First Community has also developed a Public Involvement Toolkit which can be found on the intranet and the shared drive at: H:\Public Involvement\Public Involvement Toolkit.doc
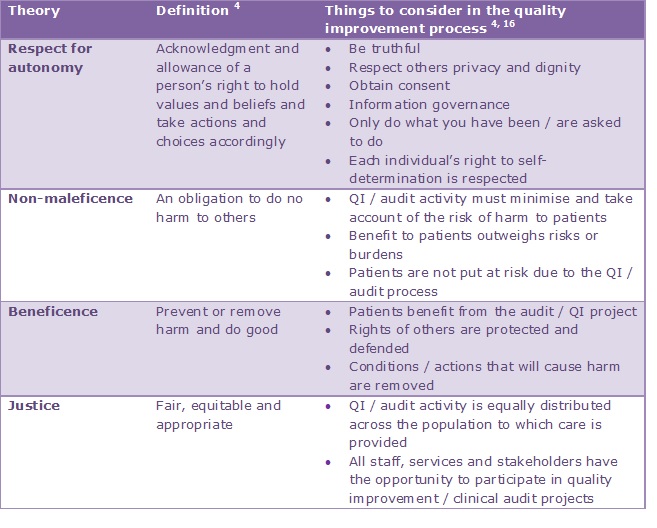
Ethics
Ethics is described as a term for examining and understanding moral life.4 Quality improvement, including clinical audit, then, must always consider what is right and what is wrong, i.e. use an ethical framework.16 Ethical screening questions can be found in the organisation’s clinical audit proposal / reporting summary and should be considered when planning any quality improvement project. Application of the theories of respect for autonomy, non-maleficence, beneficence and justice4 to the quality improvement / clinical audit process is shown below:
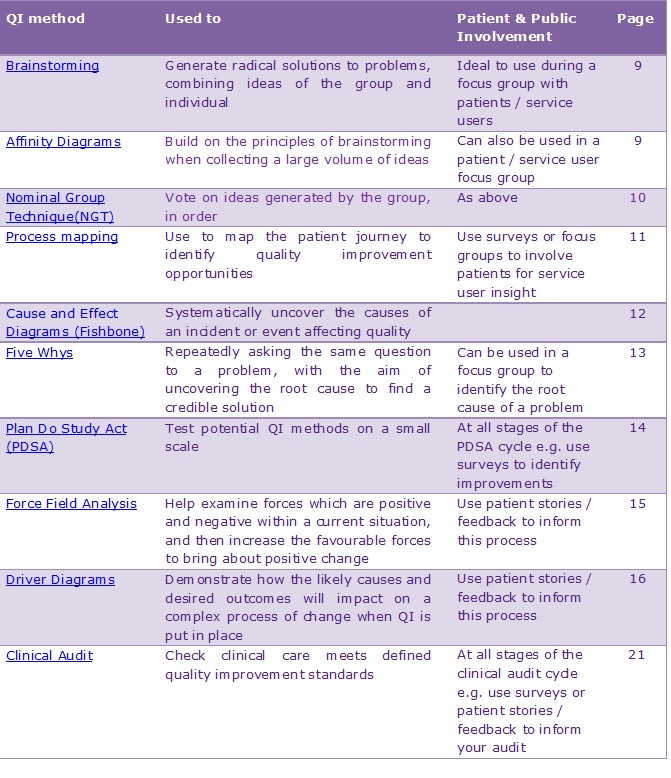
Which quality improvement (QI) tool is right for my project?
The table below shows the quality improvement tools included in this booklet and how they can be best used. 31
Methodology
The methodology for each quality improvement tool is described in Part 1. The detailed methodology for clinical audit is laid out in Part 2 (pages 27-29) and may be used for reference when using other quality improvement methods.
Other quality improvement methods
There are a range of other quality improvement methods which may be used to drive quality improvement at a service / systems level including Lean / Six Sigma, performance benchmarking, statistical process control, root cause analysis, etc. Please refer to the HQIP guide to quality improvement methods for further information.31
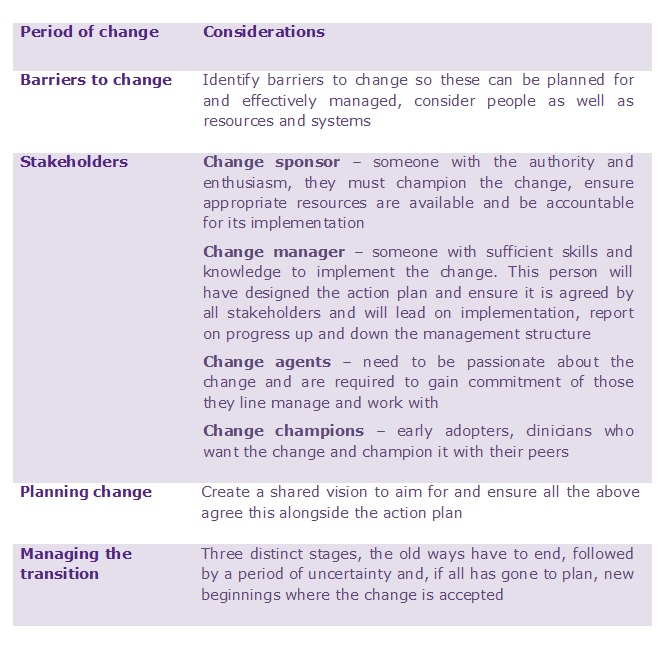
Implementing change
The findings from your quality improvement project may lead to a need to change practice. Change is complex, involving many stages. A brief guide is found below; 26 however further reading is recommended or please contact fchc.quality@nhs.net for guidance.
Brainstorming Generate radical solutions to problems, combining ideas of the group and individual
Brainstorming is considered to be a very inclusive quality improvement technique as it values ideas given by each team member. The group facilitator will note all ideas contributed by the group, which can either be achieved in a structured or unstructured manner. The facilitator’s role within the process is to ensure that all ideas are clearly written down without asking the group members to justify their ideas, thereby creating an environment where creative ideas can really flourish.19
Structured Brainstorming
-
The group agrees on a topic for the brainstorming session.
-
Everyone in the process should be actively involved in contributing ideas, so the group members are encouraged to give them in rotation. The aim of the process is to build on ideas in turn.
-
All ideas are accepted, as generating a wide variety of ideas will hopefully inspire a really good idea.
-
Use a flip chart to write a word to describe the ideas given by the group.
-
It is important to keep going until all ideas are given.
-
It’s okay to pass onto the next person, if the individual group member has given all their ideas.
-
The process of generating ideas is complete when all members have no new ideas to contribute.
-
A list is then created reviewing the ideas generated, eliminating any duplicate ideas and identifying the priority ideas to take forward.
-
An inclusive environment should be created where group individuals can be asked to clarify their ideas without the pressure of having to justify them. 19
Unstructured Brainstorming
This follows the same process as structured brainstorming with the aim of incorporating ideas from all members of the group. The process is however more open allowing the group to contribute ideas in no particular order.47
Affinity diagrams Follow a similar process to brainstorming, however it is structured to allow grouping of ideas, and is normally carried out in silence.
Affinity Diagrams follow a similar process to brainstorming, however it is structured to allow grouping of ideas, and is normally carried out in silence. This style is often viewed as being of a greater benefit to a larger group, where a greater volume of ideas are likely to be generated. The process also allows the facilitator to collect the ideas and analyse them more efficiently working with the group in silence to refine the ideas into appropriate headings.18
How do I do it?
- The facilitator will begin by asking the group an open question relating to the issue the group wish to explore e.g. ‘Why are patients waiting so long for appointments?’
- The group will then work in silence recording their views on post-it notes. The facilitator will encourage the group to write their ideas in brief statements, to make it easier to process.
- The ideas generated on the post-it notes are then randomly displayed by the facilitator. The group is then asked again to work in silence sorting the ideas into a collection of around 5-10 groupings. Individuals within the group can alter the grouping of the ideas if they disagree; this is however completed in silence without discussion.
- Once the ideas have been placed into groups, the facilitator will create headings in agreement with the group members, in a manner which best describes the collection of ideas. It is considered more advisable within this process to avoid one word headers.
- A diagram is then created connecting all the heading cards with the collection of ideas developed by the group.
- It is essential that the findings are shared with the group by the facilitator along with other appropriate stakeholders involved in the issue. 18
Nominal group technique (NGT) Nominal Group Technique (NGT) is a similar process to brainstorming and affinity diagrams
Nominal Group Technique (NGT) is a similar process to brainstorming and affinity diagrams. The concept is to create a safe and inclusive environment, in which group members are able to openly explore and create ideas and solutions to problems, without judgement from the facilitator or other group members. 24
How does NGT differ from brainstorming?
-
Each member of the group is asked to write down their ideas to a problem which has been agreed to be explored by the group. The ideas can be written on paper or post-it notes.
-
Each group member then gives feedback verbally to the group. Their ideas can either be written down on flip chart paper, or the post-it note placed by the facilitator.
-
The group will be asked to discuss the ideas openly, not in the same way structured brainstorming is conducted.
-
Voting is then carried out by the group on all the ideas raised. It is important that the facilitator ensures that this is carried out in a way that individual group members can vote for an idea without fear.
-
The idea generated which receives the most votes from the group, is then taken forward and implemented.
-
The advantages of this style over brainstorming are that there is no pressure for all group members to give ideas, or to feel embarrassed if they don’t have one. 24
Process Mapping What is it and how can it help me?
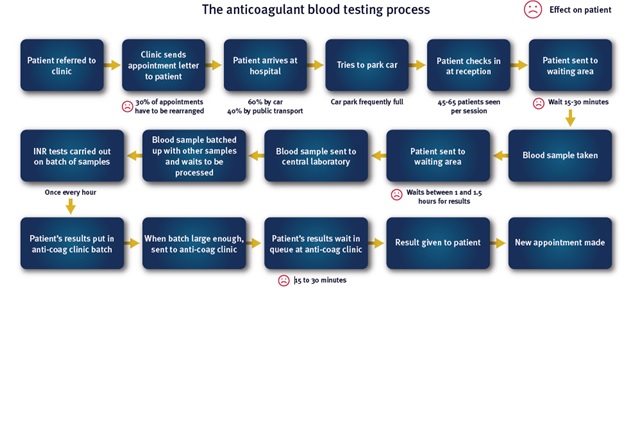
How to use it…
Starting with a high level process map, the scope of the process and significant issues are set out, step by step, to create a more detailed map. The exercise offers all those taking part a broader insight into the process under review and sets out exactly what happens in practice, as opposed to what those involved think happens.
By placing the patient and their needs central to the journey and involving patient representatives in the exercise, barriers to safe, effective care are identified and process changes can be discussed, agreed and designed out of the system.
Process mapping promotes staff ownership of each stage of the process and enables all stakeholders to input to avoid the ripple effect, whereby a change to one stage of a process adversely affects another stage. Mapping should cross team and department boundaries, revealing the whole process from start to finish, ensuring quality improvements which flow across teams and departments.
To be most effective, process mapping should be carried out involving staff associated with the clinical process or pathway under development, along with patients for service user insight.31
What is it and how can it help me?
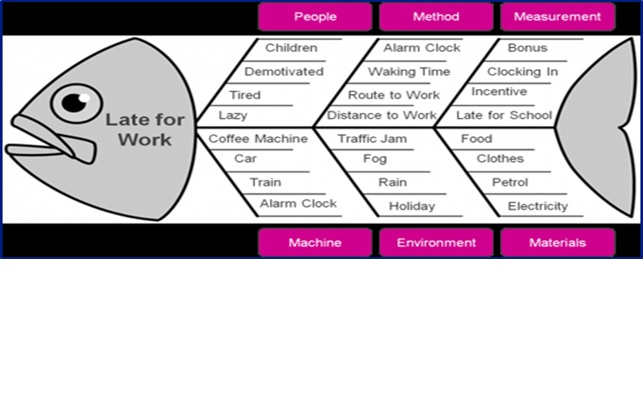
The cause and effect diagram is sometimes called a fishbone diagram or an Ishikawa diagram after its inventor Professor Ishikawa. The purpose of the cause and effect diagram is to identify the root cause. The process is structured in a way that investigates all the possible causes of a problem through a thorough analytical process. It is often used in retrospect, after an adverse event has occurred, in order to get to the root of the problem. Once the problem is identified, the aim is for it to be permanently removed, the error rectified, or delay reduced. 31
The ‘effect’ is the problem which has been identified to work on; the tool is then used to explore a broad range of possible root causes, which need further investigation. By going through the process of building the diagram with the multi-disciplinary team and associated stakeholders, everybody gains insights into the problem, alongside possible solutions. 20
The tool doesn’t just focus on the obvious or the historical background to the problem. It allows the user to understand the issue, and to identify all the possible causes clearly and more rapidly. The subsequent result is that a quality improvement can be embedded more efficiently, ultimately benefitting the patient. 20
How to use the Cause and Effect diagram
- The problem is identified and written in a box with an arrow drawn pointing towards it; blank fishbone templates to help you with this process can be downloaded from the First Community intranet.
- The problem then needs to be explored, who is involved, what is the problem and when does it occur?
- The major factors are then identified and four or more branches are drawn off the large arrow to represent main categories of potential causes, or follow the pre drawn template.
- Categories could include: equipment / machines, environment, procedures / methods, materials, measurement and people. The categories used should be relevant the particular problem / delay.
- An affinity diagram can be used as another means to explore and generate headings from a team (see page 9).
- Brainstorming can be used with each of the main categories, to identify ‘causes of causes’. The branching process then continues until every possible cause is identified.
- Once a diagram demonstrating all the possible causes of the problem / delay has been created, depending on the complexity the most likely causes can be investigated further. This may involve setting up interviews with team members or service users to get the patient perspective, which may require ethical consideration.
- Leads responsible and action plan completion dates need to be put in place, to ensure an open and transparent process.31, 20
What is it and how can it help me?
- It is a technique which helps to quickly identify the root cause of the problem.
- It can be used to determine the relationship between different root causes.
- It is an easy process to complete and is best suited to trouble shooting simple problems for quality improvement.
- The process is less effective with a complex problem as it can lead the user down a single track, or a small number of tracks, of enquiry, when there could be multiple causes. 36, 40
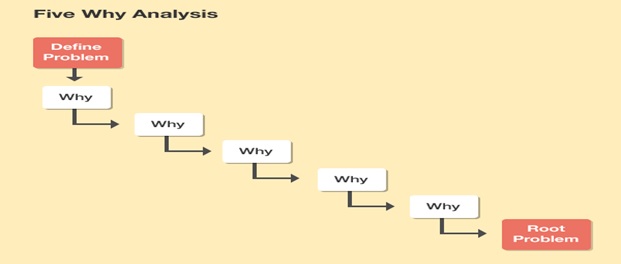
How to use the ‘5 whys’
- A specific problem is identified. Writing the issue helps you formalise the problem and describe it completely. It also helps a team focus on the same problem.
- Ask the team why the problem happens and write the answer down below the problem.
- If the answer you just provided doesn’t identify the root cause of the problem that you wrote down in Step 1, ask why again and write that answer down.
- Loop back to step 3 until the team is in agreement that the problem’s root cause is identified. Again, this may take fewer or more times than ‘5 Whys’.36, 40
‘5 Whys’ and the Fishbone Diagram
The ‘5 Whys’ can be used individually as a quality improvement tool, or as a part of the Cause and Effect/ Fishbone diagram.20 Once all inputs are identified on the diagram, you can use the ‘5 Whys’ technique to drill down to the root causes. 36, 40
This is used to introduce and test potential quality improvement projects, it can also be used to refine the process prior to implementation.31
The model consists of two parts. The first three questions help us define what we want to achieve.
The second part of the PDSA cycle outlines the steps for the actual testing of the change ideas. The cyclical nature of the model allows the change to be refined and improved through repeated cycles of testing and learning. It is a vital tool for continuous quality improvement.25
**DIAGRAM
Part 1 – The Framework
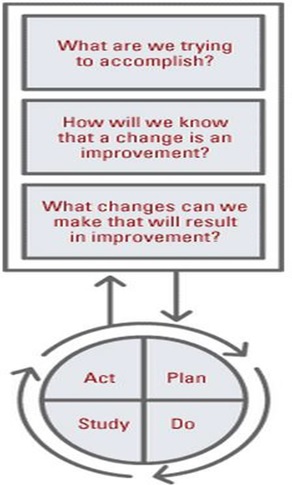
The first three questions of the Model for Improvement will effectively form the framework for your QI project:
- What are we trying to accomplish?
This takes the quality issue and turns it into an aim. Why the project is important to the team/organisation, how it will benefit patients and would there be a business case for it? 25
- How will we know that a change is an improvement?
This focuses on measuring key parameters linked to the project, tracking improvement, quantifying problems and identifying opportunities.25
- What changes can we make that will result in improvement?
It is important to consider what improvements are required to make changes. Driver diagrams described on pages 15 and 16 can help in this process.25
Part 2 – The Engine
The second part of the Model for Improvement is the engine for developing, testing and implementing changes. This is carried out by using Plan, Do, Study, and Act (PDSA) cycles: 25
Plan
- What is the objective for the cycle?
- What questions need to be asked, any possible early predications?
- How will it be carried out? (Who? When? How? Where?) 43
Do
- Carry out the plan
- Document any problem
- Begin data analysis
Study
- Complete data analysis
- Compare results to the predictions
- Summarise the results
Act
- Can the idea be implemented?
- Try something else?
- Next cycle?
PDSA cycles are designed to refine the approach and ideas created with a quality improvement project. It enables the project to be implemented in practice and learn what is or isn’t working.25 It is unlikely that the process will be successful on the first attempt; the idea often needs to be changed through a number of PDSA cycles before it starts to work reliably in practice.25
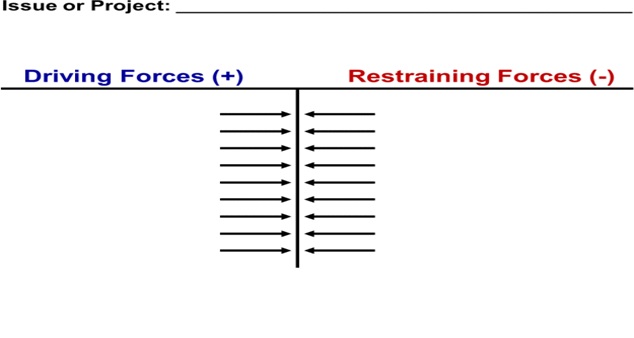
Force Field Analysis Force Field Analysis is a QI tool designed to identify driving (positive) and restraining (negative) forces that support or work against the solution of an issue or problem
The aim is to identify the driving and restraining forces in order that steps can be taken to reinforce the driving forces and reduce the restraining forces. 23
What does the Force Field do?
- Allows easy comparisons of the “positives” and “negatives” within a given situation.
- It encourages members of a team to think together about making the desired change a permanent one.
- It enables individuals within a team to agree on the priority of each factor and on each side of an issue.
- It creates an environment where reflection can flourish within a group. Allowing honest analysis of an underlying root cause of a problem, with the aim of breaking down barriers and misconceptions.23
How do I set up a Force Field Analysis?
- The facilitator of the group starts by drawing a letter “T” on a flipchart page.
- The issue or project is then written across the top of the page.
- The left column is “Driving Forces” and the right column is the “Restraining Forces”.
- Brainstorming or nominal group technique (NGT) can be used to generate the list of forces or factors that are driving the issue or project. The restraining forces or issues holding things back are also noted.
- It is important to clarify ideas generated within the group and remove any duplicate ones.
- The ideas can be placed within rank order if the team feels that this will help the group’s focus of the process required. Increasing the thickness of the arrows according to the impact of the forces (i.e. the thicker the arrow the greater the impact) gives a visual impression of the priorities for change.
- Ideas of the actions required to reduce the restraining forces and reinforce the driving forces are then developed by the group. This enables the group to move forward and implement positive change with a collective ownership .23
Example of a Force Field Analysis
Actions to reduce restraining forces:
Actions to reinforce driving forces:
Driver diagrams
A driver diagram is a useful strategy when dealing with a complex problem. It illustrates a ‘theory of change’ and how it can be used to plan improvement project activities. This technique provides a way of systematically laying out aspects of an improvement project so they can be discussed and agreed amongst the team.22
There is no right or wrong driver diagram – it should represent the team’s understanding of the system in which they are trying to improve. The driver diagram is likely to change through the project as greater understanding of the system and processes are established.
The driver diagram on page 17 was produced by a project team to develop an improvement strategy to meet the team’s aim of improving the in-patient experience for adult female in- patients on a mental health unit in order to increase satisfaction by 25% in 10 months. 22
Driver diagrams oonagh.park@nhs.net
A driver diagram is a useful strategy when dealing with a complex problem. It illustrates a ‘theory of change’ and how it can be used to plan improvement project activities. This technique provides a way of systematically laying out aspects of an improvement project so they can be discussed and agreed amongst the team.22
There is no right or wrong driver diagram – it should represent the team’s understanding of the system in which they are trying to improve. The driver diagram is likely to change through the project as greater understanding of the system and processes are established.
The driver diagram on page 17 was produced by a project team to develop an improvement strategy to meet the team’s aim of improving the in-patient experience for adult female in- patients on a mental health unit in order to increase satisfaction by 25% in 10 months. 22
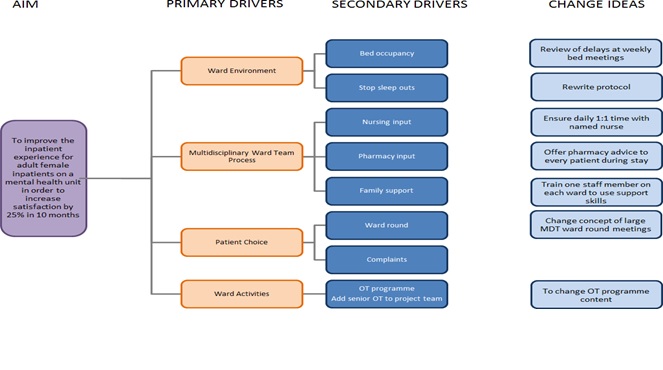
Aim
- The aim should be meaningful to patients, service users and their families.
- Having a patient or services user’s perspective can be beneficial at this stage of the process.
- The team should focus on what they want to achieve, and it must be SMART (Specific, Measureable, Achievable, Realistic and with a Timeframe). It cannot simply be “to improve” or “to reduce”.
- The data available should be analysed to understand the main quality issues.
- A well-written ‘Aim’ helps identify the ‘Outcome Measure’. 22
Primary Drivers
- These are the main topics or areas that need to be focused on, in order to achieve the aim.
- The key areas of the system that will be of influence within the project should be captured within the drivers.
- Clearly identifying the primary drivers will help identify the process measures. 22
Secondary Drivers
- Each primary driver may have secondary drivers, and these will need to be in place to positively influence the primary driver.
- Using stake-holders may help to understand the primary drivers, and to identify suitable secondary drivers.
- The difference between primary and secondary drivers is of vital importance.
- If the driver is big and critical, it should be considered as a possible primary driver.
- Establishing the secondary drivers helps identify relevant change ideas. 22
Change Ideas
- These are the ideas that the team would like to test and should go into the project plan, in order to help move towards the aim.
- All change ideas should have an effect on at least one secondary driver and therefore all change ideas are expected to help achieve the aim.
- Prioritising the change ideas in terms or rank or effort with the stakeholders involved, i.e. Which change would have the biggest impact? Which is easiest to accomplish? Which will help the process of implementation of the change? 22
![]()
![]()
All templates described in Part 1 can be found on the First Community intranet and the shared drive at: H:\Clinical Audit\QI Tools